1.2. Cartographic Representation Rules For Interactive Web Maps
Learning Objectives
You will be able...
- ...to list two reasons why map layer control tools are often implemented in interactive maps.
- ...to explain the difference between normal zooming and adaptive zooming.
- ...to list three interactive tools that can be implemented in an interactive map besides navigation and layer control tools.
Introduction
|
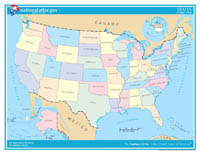
Today, almost everyone possesses a computer and uses it for e.g. planning their itinerary already at home, before starting the trip. Therefore, if maps are consulted, they are displayed on the screen. Since the screen size is more or less constant, there occur a few problems when visualising a map on the screen, as we already mentioned in the previous chapter. Imagine visualising the entire USA on the screen. It is obvious that you cannot detect any details of particular regions. By clicking on the thumbnail on the right, you see a map of the United States whose size is about the size of an averaged screen (1024 x 768). |
 Map of the United States (National Atlas U.S.) Map of the United States (National Atlas U.S.) |
Besides the state boundaries, the main lakes / rivers and perhaps the main cities you cannot visualise anything else in the map. Otherwise the map's content would be illegible. If you want to pack the same content of a paper map whose size may be three times a screen map in a screen map, you have to design the map in an interactive way. In this unit, we will introduce the interactive tools that can be implemented in a screen map.
