1.3. Cartographic Representation Rules for Topographic Maps
Learning Objectives
You will be able...
- ...to list the content of a topographic map.
- ...to name three graphical improvements that lead to a quality topographic screen map.
- ...to choose the best colours for the objects of a topographic map.
- ...to explain how to place best the labels for points, lines and areas.
- ...to list three interactive tools that may be implemented in an interactive topographic map.
Introduction
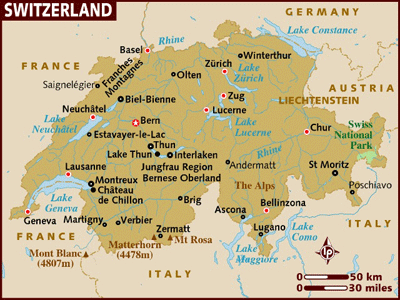
You find lots of topographic screen maps in the Internet. But most of them are scanned paper maps. As you already learned in the previous chapter, this method does not lead to a quality screen map. Even if you find a topographic map that has been prepared for the output on the screen, they often lack of good quality as the next example shows:
 Topographic Map found in the Internet in the year 2007 (Lake Thunersee is not
a village!), reproduced with the permission from the Lonely Planet website www.lonelyplanet.com
© Lonely Planet Publications (Lonely Planet)
Topographic Map found in the Internet in the year 2007 (Lake Thunersee is not
a village!), reproduced with the permission from the Lonely Planet website www.lonelyplanet.com
© Lonely Planet Publications (Lonely Planet)In this unit we want to introduce you some cartographic representation rules that lead to a quality topographic map.
At the end of the unit we present you a few interactive tools that can be implemented into a topographic screen map.
