1.3.1. Data Preparation
Imagine that we have collected all the needed data for an application. Often the data does not fit the application, because e.g. the geometry is too detailed or the file might cover the whole world, but for our project we only need Europe, etc. Therefore, we have to prepare the data until it fits the requirements of the application.
Geometry Data
Depending on the application, there are several possibilities of adapting the geometry to the requirements of the project. Some examples are listed below:
-
Shape Simplification
The data may be too detailed. Reasons may be, that the file would be too large without eliminating any data or that the presentation on the screen is not satisfying (coastline is too detailed for the presentation on a screen). Therefore, the geometry has to be generalised.
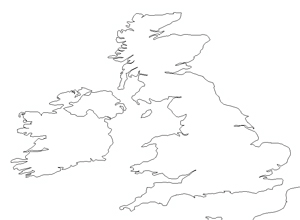 Ungeneralised Coastline (ESRI) Ungeneralised Coastline (ESRI) |
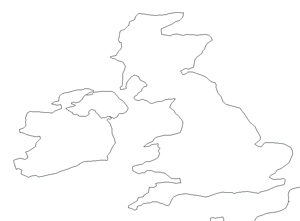 Simplified Coastline (ESRI) Simplified Coastline (ESRI) |
|
If you are interested in detailed theory about generalisation - especially for maps - have a look at the GITTA lesson "Generalisation of Map Data". |
-
Clipping specific regions
Imagine developing an application with the title "Europe and its Countries" and you have a dataset of the whole world. It is obvious that you have to crop only the needed region.
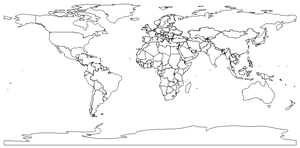 Whole Dataset (ESRI) Whole Dataset (ESRI) |
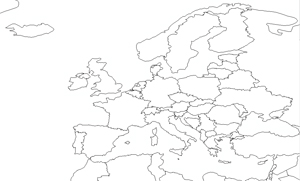 Clipped Region (ESRI) Clipped Region (ESRI) |
-
Aggregation of data
When planning a project with the title "The cantons of Switzerland" and you possess a dataset with all communes of the country, you have to merge them to reach the wanted dataset.
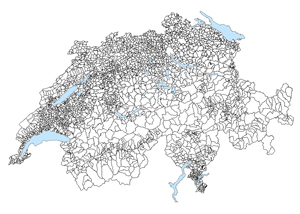 Unmerged Data, reproduced with the permission of swisstopo (JD072706) (Swisstopo) Unmerged Data, reproduced with the permission of swisstopo (JD072706) (Swisstopo) |
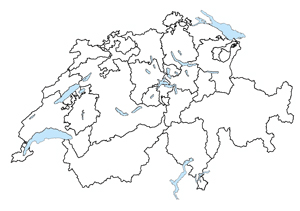 Merged Data, reproduced with the permission of swisstopo (JD072706) (Swisstopo) Merged Data, reproduced with the permission of swisstopo (JD072706) (Swisstopo) |
-
Etc.
Thematic Data
Not only the geometric but also the thematic dataset has often to be prepared to be able to include it in the application. Deleting or adding entries are common operations in this phase.
 Table with too many entries. Each commune of Switzerland features 16 attributes.
Reproduced with the permission of swisstopo (JD072706) (Swisstopo)
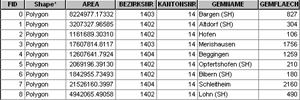 Table adapted to the application. Each commune of Switzerland features 7 attributes.
Reproduced with the permission of swisstopo (JD072706) (Swisstopo)
Table adapted to the application. Each commune of Switzerland features 7 attributes.
Reproduced with the permission of swisstopo (JD072706) (Swisstopo)In the given example we deleted entire attributes. Additionally or alternatively you can delete individual entries. Of course, for the given example it is not reasonable to delete any entries because normally (depending on the aim of the project) all communes have to be visualised. But imagine creating an application with the title "Visualisation of major hurricanes in the USA between 1850 and 1999" and you have a dataset which includes also the minor storms. Needless to say that you have to delete all those minor storms in your dataset.
Often you have data from different sources. In a first step it has to be
defined if geometric and thematic data will be stored in the same file (or
database) or separately. In a second step the data has to be brought together
in
one or several files.
There are several possibilities of storing
thematic data: in a database, by using XML, Text files, etc. How to store best
the data will be explained in the following lesson Data Storage and XML.
Exercise
In a former exercise you had to define the content of an application with the title "the visualisation of major earthquakes in USA between 1852-2003". We told you that you receive two datasets, one with the earthquakes and one with the state boundaries:
- State boundaries: includes the geometry of the boundaries and thematic
data about the states such as name, area, etc.
 Attribute table of state boudaries (National Atlas of the U.S.)
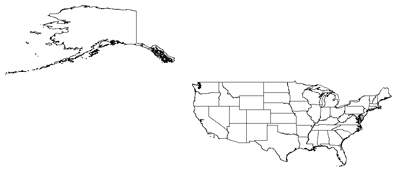 Visualisation of the above attribute table (state boudaries) (National Atlas of the U.S.)
- Earthquakes 1850-2004: includes the coordinates of all earthquakes and
additional attributes such as magnitude, depth, etc.
 Attribute table of earthquakes (National Atlas of the U.S.)
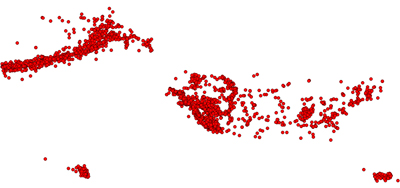 Visualisation of the above attribute table (earthquake) (National Atlas of the U.S.)
We now want you to download these two datafiles, view them and prepare them for your application whose content you already defined in chapter Content. Depending on your defined application content you have to adjust these two datasets. You can delete attribute categories and/or earthquake and state boundary entries. Of course you are free to add new attribute categories as well. But you have to be aware that for each existing entry you have to fill in the right attribute values. If you have a lot of entries and a lot of different values, this step can be time-consuming.
- Download: states.zip (24KB)
- Download: earthquake.zip (359KB)
Open the .dbf files in Excel and study the dataset. Make your own
decision about which attribute categories do you want to keep and which ones
do
you want to delete. Explain in words which entries do you want to keep and which
ones do you want to delete for each dataset.
Example:
- Keeping the following attributes in earthquake: year, location, etc.
- Deleting the following attributes in earthquake: hour, minute, second, etc.
- Deleting the following entries in earthquake: year <1950, etc.
Write down your decisions and hand it in to your tutor, together with your content essay.
