1.2.1. Content
Depending
on the target audience and the aim of the project, the content and the
interactivity parts vary from application to application.
In this chapter we will demonstrate how to define the content of an
application using an example. The topic of our example is "the
visualisation of major earthquakes in USA between 1852-2003". We
therefore want to create an interactive map.
We do not want to give you
a solution how this interactive map should be realised because there are several
ways how to do this. We only introduce you the individual steps that are needed
to define the content of an application with the given topic. In addition we
show you some possibilities of how some aspects could be realised.
At first, all components that will be included in the
application have to be defined. Not only the components but also their
interactivities have to be defined. There are several possibilities of how to
realise a component in an interactive way, as you will see.
The subject of our application is visualising earthquakes. The first question that has to be posed is: How to visualise the earthquakes best?
- Earthquakes: It has to be defined how
to visualise the individual earthquakes.
First of all we have to make a decision about the visualisation attributes. The earthquakes can be represented as areas (dispersion radius) or as points (epicenter). When visualising the earthquakes e.g. as points, we have to make a decision about the attribute that will be visualised. This may be the magnitude, the year, the damage costs, etc. After having defined the visualisation attribute, we have to specify the classification which determines the number of classes the values have to be divided into and the calculation type (e.g. equal intervals, quantiles, etc.) which defines the border of the classes. When e.g. visualising the magnitude of the earthquakes we first have to decide how many classes will be used and afterwards the calcuation type to get the border of each class. To visualise the differences of the classes we may change the size or the fill colour of the point symbols for each class. The following illustration shows an exemplary way how the visualisation of earthquakes may be realised: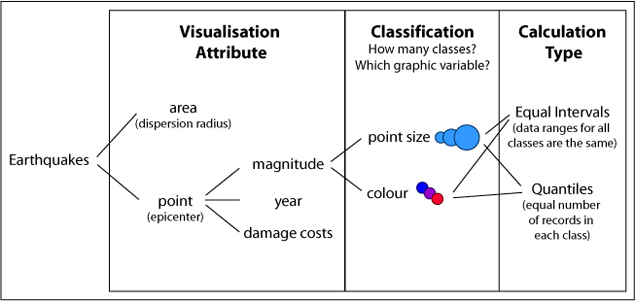 Visualisation of Earthquakes
You will learn more about the visualisation rules of data in a further lesson. - Area (Map):
In our application, we want to visualise the location and the magnitude of the earthquakes in the United States of America. Therefore we need a map which shows these geographical conditions. Examples (aerial or satellite maps, topographic maps, etc.) of possible maps are shown below. The decision which map is the best for our application is up to you. Consider that the map below are just examples. There exist many more maps.
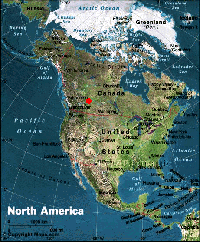 North America (Departement of Mathematical and Statistical Sciences University of Alberta) North America (Departement of Mathematical and Statistical Sciences University of Alberta) |
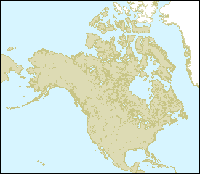 North America (C-MAP - The Electronic Chart Standard) North America (C-MAP - The Electronic Chart Standard) |
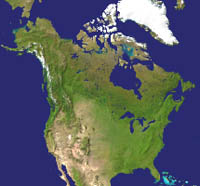 North America (Primap Software) North America (Primap Software) |
- Thematic Navigation: The user should
have the possibility to orientate oneself thematically in the application.
This can be realised by giving the user the possibiliy to get some
information about the individual earthquakes, etc.
First of all we have to decide which information do we want the user to know, whether we want to give the user the possibility to modify the application with modifiable attributes, etc.? In our earthquake example we could for example give the user some additional information about the individual earthquakes such as the exact date, the exact location (longitude and latitude), etc. There are several possibilities of how to realise this: mouseover effects, onclick effects, etc. The following examples give you an impression of how such additional information or interactions with the user could be realised.
In the first example you have to click on the circles to get additional information about the individual circles. In the second example you have to move the mouse cursor over the red circles to get the information.
The last example shows you a possibility of how a user can interact individually with a given map. You are able to switch on an off some layers by clicking on the checkboxes.
| Shows Information on Click | Shows Information on Mouse Over | Layer Control Functions |
- Spatial Navigation: The user should have
the possibility to orientate oneself spatially and navigate (zoom, pan, etc.)
in
an interactive map.
Therefore, we recommend to include spatial navigation tools into an interactive map. A reference map which shows the original map in miniature and gives information about the zooming factor and the zoomed region is a good help for the user to keep the orientation in the map. The following images show some examples what type of spatial navigation tools may be implemented. They range from simple zoom functions such as zoom buttons until more complex ones, e.g. creating a zooming fence.
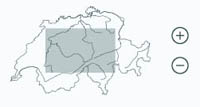 Simple Zooming Tools (Isakowski 2002) Simple Zooming Tools (Isakowski 2002) |
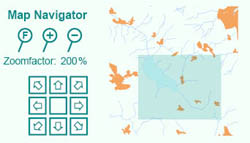 Full View, Zoom Buttons, Pan in 8 directions (Neumann 2002) Full View, Zoom Buttons, Pan in 8 directions (Neumann 2002) |
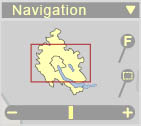 Zoom Slider, Zoom Buttons, Full View and Zooming Fence (Isakowski 2004) Zoom Slider, Zoom Buttons, Full View and Zooming Fence (Isakowski 2004) |
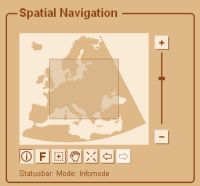 Zoom Slider, Zoom Buttons, Full View, Zooming Fence, Pan, Center, Previous
Setting, Next Setting as well as movable rectangle (map extent) (Schnabel 2007) Zoom Slider, Zoom Buttons, Full View, Zooming Fence, Pan, Center, Previous
Setting, Next Setting as well as movable rectangle (map extent) (Schnabel 2007) |
- About the Project: For maps - analogue or digital - it is necessary to declare information such as who is the author of the application, which data did the author use, where did the data come from, when was the application created, etc. The decision which items have to be included in the "about the project" part depends on the target audience. For example a map for children does not have to declare many items in the "about the project" part. Unlike a map that is made for scientists. In this case the "about the project" part of the application has to include detailed information about e.g. the origin and the up-to dateness of the data, etc.
Exercise
Write a short essay about the content of an application with the title
"the visualisation of major earthquakes in
USA between 1852-2003". Granted that you already have
the thematic data as ![]() shapefile with the
following attributes for each earthquake: year, month, day, hour, minute,
second, location (short description in text format), longitude, latitude and
magnitude. In addition you have a shapefile with the state boundaries of the
United States and their names.
shapefile with the
following attributes for each earthquake: year, month, day, hour, minute,
second, location (short description in text format), longitude, latitude and
magnitude. In addition you have a shapefile with the state boundaries of the
United States and their names.
First of all you have to
define for which target audience do you want to create your application.
Afterwards, like it is written above, you first have to make a decision about
the visualisation of the earthquakes. Then you have to choose the map type, that
you want to include as basic map, and so on.
After having defined the
main parts of the content of your application, list all the other items and
their possible interactivities that you want to include in your application.
Give reasons about your decisions.
Hand in your essay to
the tutor.
Take in account that the content of an application depends always on the definition of the target audience.
