1.2.1. Level of detail
Databases of Geographic Information are able to store huge volumes of complex data about earth. The problem is that when we view the data, for example on a map, only a small part of it can actually be seen. There are two main reasons for this.
- The scale at which the data is shown
- The resolution of the device on which the information is displayed
Scale
We might think of the scale as relating to how far away the objects being shown are from the viewer. Clearly, the further you are from something the smaller it will appear and so the less detail about its shape you will be able to make out. In maps to ensure that features can still be displayed at small (i.e. distant) scales, they are symbolised so they always appear the same size, in effect enlarging them. This causes additional problems when large amounts of detail are shown because it makes the map appear cluttered and difficult to read. This was shown previously in the interaction in the Unit on Maps on Small Displays
Resolution
Resolution relates to the ability of the device presenting the data to draw detail. For a computer screen this depends on the number and size of pixels. For a paper map, on the smallest size of a dot of ink that can be printed. As you have seen in previous in the unit on Display Facts, for mobile devices the resolution of the screen is very low and in addition the size small. There is also a third factor that is important when data is shown on a screen which is how fast it can be rendered. On computers, this will depend on the speed of the processor or the graphics card, and if the data is being accessed over a network, how fast it can be downloaded. For mobile devices this is both these factors are limited, meaning that rendering large volumes of data takes a very long time.
LOD Techniques
Level of detail (LOD) techniques aim to address these problems by selecting only a small proportion of the data to show at particular scales. Because only a limited amount of the detail will be anyway visible this does not effect the graphical impression. To achieve this level of detail techniques need to consider three factors:
- How do we select only that portion of the data that has meaning in the context of the resolution of the viewing device?
- How do we organise the data so that different levels of detail can be managed effectively?
- How much data must be presented to convey the information content of the scene?
Such techniques are used in most technologies for graphically displaying
information, for the example of three dimensional models see the lesson Advanced 3D modelling . Here we focus on
techniques for two dimensional maps.  Levels of detail for a river at different zoom levels. 100% (left-hand figure), 50
% (figure In the middle) and 37.5 % (right-hand figure)
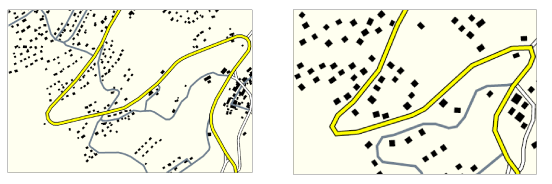
  Buildings and road network and their representation at the LoD 1:25'000 (left-hand
figure) and 1:100'000 (right-hand figure)
The images above show examples of levels of detail from (Cecconi et al. 2002) for different types of geographic features.
