1.4.4. Examples of Temporal Navigation in 2D Maps
Within thematic maps, time plays an important role. Imagine you would have to visualise the air pollution of Bern (Bern is the capital city of Switzerland): The first thought would certainly be "For which time period do we have to visualise the pollution (years, seasons, months, days, hours, minutes)?" Without these time specifications it would not make sense to produce an air pollution map.
Often, you have the possibility to animate the various themes that stand for a defined time chronologically. The animation allows you to observe the variation of a theme over a specific time span.
The following examples show interactive maps that feature temporal navigation.
Pearl Harbor
|
This multimedia presentation of the attack on Pearl Harbor
contains a time line that is combined with small
multiples. Look what happens when you move the mouse cursor over the small squares between 0700 and 0900 o'clock and pay attention what happens to the clock that is down to the right. |
 Japanese Attack on Pearl Harbor (National Geographic) Japanese Attack on Pearl Harbor (National Geographic) |
Replay of Bay Area Air Traffic
|
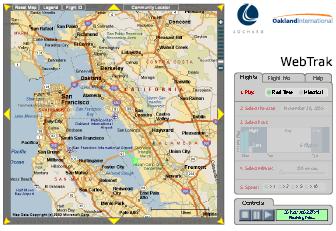
Within this application the air traffic of San Francisco and it's surroundings can be visualised and replayed. It includes specific information about flights from Oakland, San Francisco, San Jose International Airports as well as from smaller, general aviation airports in the area (Oakland International). You can choose between real time or historical information. "Real time flights are delayed by 10 minutes. Noise data will be updated daily and may only be viewed during historical playback" (Oakland International). When selecting historical information you are able to define the exact date, hours and even minutes. Explore the application! You have to click on the thumbnail to reach the application. |
 Air Traffic Application (Oakland International) Air Traffic Application (Oakland International) |
Weather Map of Switzerland
|
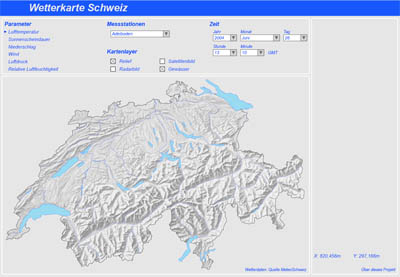
This application visualised all weather stations of Switzerland broken down by air temperature, duration of sunshine, precipitation, wind, air pressure, and relative atmospheric humidity. The point of time that was visualised could be defined with several selection lists (year, month, day, hour and minute). Note, that we cannot provide the application anymore. Click on the thumbnail to enlarge the screenshot. |
 Weather Map Switzerland (Schmid 2005) Weather Map Switzerland (Schmid 2005) |
Adaption of Map Depending on Location, Time and Activity
The following example shows the opening and closing times of various features. The time dial changes the visibility of the features; each feature has an opening and a closing time and depending how long it will remain open it is shown or hidden. The opacity of the feature depends on the distance between the location of the red point and the feature; the closer the feature the less opaque. You can change the location of the red point in the map by dragging it.
How a service adapts to the contexts of location, time and activity (Departement of Geography)