1.3.2. Computing transformations
Computing variable scale transforms
The detail-in-context transformation works on the distance a point is from the focus, so you can look at how the function appears by plotting along a single dimension x. In this activity you will compute one of the transforms along a line, for example from 0..40. You can perform the calculations using a pen, paper and calculator, though you will find it easier to use a spreadsheet package like Microsoft Excel.
Functions
You should use one of the functions shown in the examples previously. The equations for these are:
Variable Scale Equations
| Linear |  |
| Fisheye |  |
| Gaussian |  |
| Tanh | |
| Where dist' is the normalised distance from a point to the focus point and mag is the value of the amount of magnification at the focus. SD in the eqnation of the Gaussian is the standard deviation of the Gaussian kernel you can set this to 0.1 or try varying it. | |
Calculation Steps
In computing the values you will need to perform the follow the steps, you can put each in its own column of the spread sheet:
- Create a column of values for the x coordinates, i.e. 0 to 40
- Define a variables for the magnification, e.g. 2, the radius over which the transform should apply, e.g. 10, and the point of focus. The focus should be a point from your x value, e.g. 20.
- Calculate the distance from each point to the focus.
- Normalise the distance over the radius
- Compute the transformation on the normalised distance and un-normalise the result, i.e multiply by the radius. Remember the function only needs to applied to points that are within the radius and not zero.
- Compute the new x coordinate from the distances.
Graphing the function
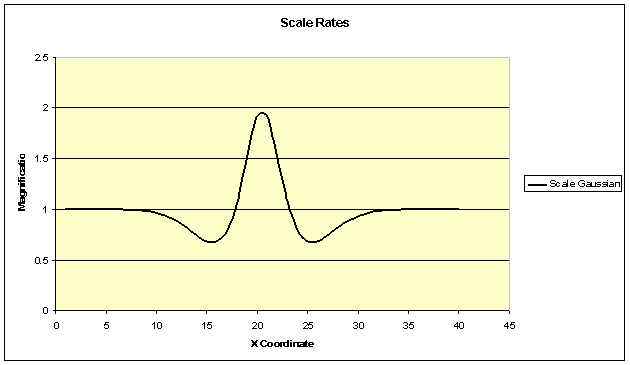
It is useful to visualise how much the
function is magnifying the map space at different points within the radius. To
compute the scale create a new column and in this divide the difference between
two steps of the transformed space with the equivelent in the untransformed
space. For you first row you will have no entry. Plot these values in a graph
against the untransformed x coordinates. Your graph should look something like
the image below of the Gaussian function.Try changing the values for the magnification
and radius and observe how it effects the graph. In particular, consider how the
function demagnifies in some points and magnifies in others.

What is the relationship between the value of the magnification and the transformation function? Think about how you calculated the magnification in the graph. (Click here for more information)
