1.3.1. Screen Layout
According to (2003) there are mainly two strategies to manage the layout of the display area:
- High-Density Layout Strategy (for
conveying a high volume of information)
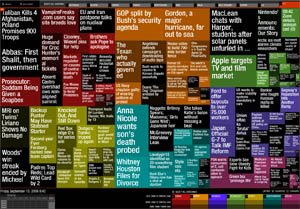
- Tabular Arrangement: Data is
organized in a list of structured values.
 Tabular Arrangement (Weskamp)
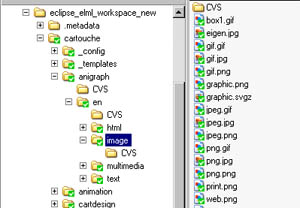
 - Hierarchical Organisation:
The information is structured into tree-like hierarchy as in a file
system graphic representation.
 Hierarchical Organisation
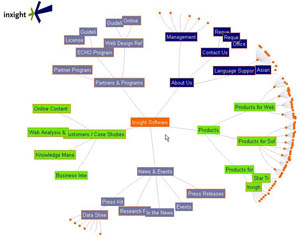
 - Graph: Data is represented
graphically, like a chart or a diagram.
 Graph (Inxight)
- Tabular Arrangement: Data is
organized in a list of structured values.
- Limited Information Layout Strategy
(where the aim is to reduce the displayed data)
- Step-By-Step Interaction:
The data are cut up and displayed in one-page stages (e.g. Wizard
Interface).
 Wizard Interface with Back and Next buttons (screenshot © Eclipse)
 - Details on Demand: Some
optional data can be shown on user request (e.g. dialogs that have a
"more details" button).
 Optional data can be shown on user request
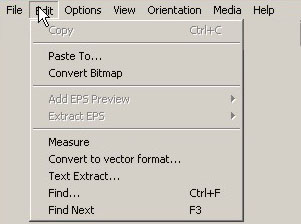
 - Disable/Minimise Irrelevant
Information: There are many ways to minimise data; e.g.
shading it.
 Disabled Unavailable Information for a Menu (screenshot © Ghostgum Software)
- Step-By-Step Interaction:
The data are cut up and displayed in one-page stages (e.g. Wizard
Interface).
These strategies are complementary and should always be used toghether in every GUI screen. Depending on the case, one of the two will be dominant, but it is essential to be accurate in the exact mixing of them. (Marinilli 2003)
