1.4.3. Classification
How classification is
done?
The classification operation behaves pretty much like
a group of stacked sieves. Each sieve acts as a class boundary, and only values
of certain sizes are allowed to pass into one of several classes. (Dent 1999)
Discover interactively the sieve analogy: Click on "Classify Data" to start classification
Classification of data (Institute of Cartography)What is a classified
map?
A classified map represents data that has been grouped
into different classes. On the map, the different classes can be distinguished
e.g. by their colour (hue, brightness, or saturation).
Why can it be useful to classify
data before creating a map?
Data is classified for
three reasons:
- To reduce a large number of individuals (objects) to a smaller number of groups in order to facilitate description and illustration (Dent 1999).
- To define phenomena - classes about which general statements can be made (Dent 1999).
- The human eye only has a limited ability to discriminate a large number of different areal symbol shades (concerns maps with proportional symbols) (Slocum 1999).
Although classification may lead to a loss of detail, it usually makes meaningful interpretation possible. (Dent 1999)
|
There are several methods to classify data. The major ones are presented in the following table. An example that deals with population density data of Europe is used to demonstrate the differences between the methods. See the figure to the left to watch a data-set of the population density. Take into account that the best classification method depends on the data set that is classified. Therefore, the following results refer only to the data set that is shown on the right! |
 Data distribution graph (Institute of Cartography) Data distribution graph (Institute of Cartography) |
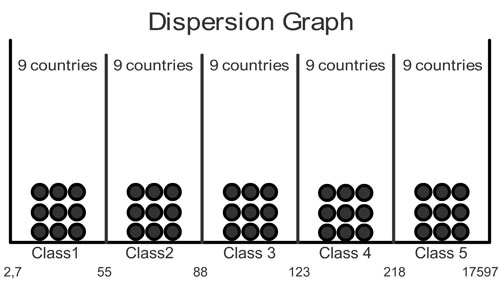
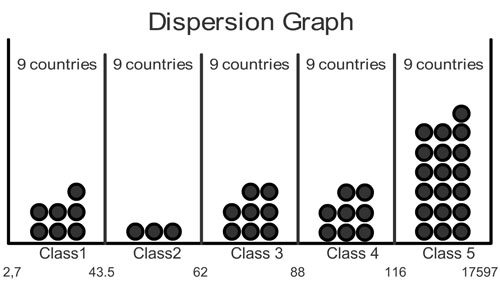
| Method | Example | Dispersion Graph |
|---|---|---|
| Equal Intervals | 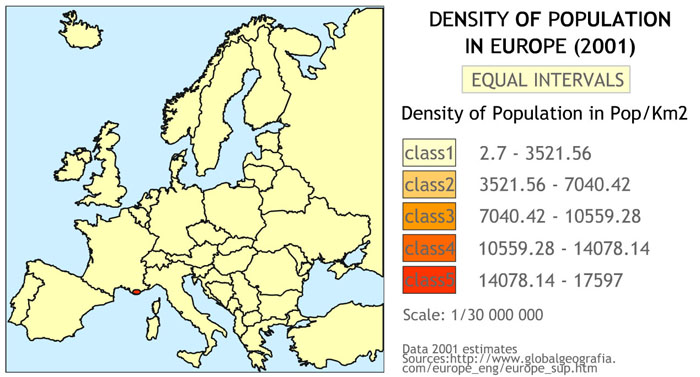 (Institute of Cartography) (Institute of Cartography) |
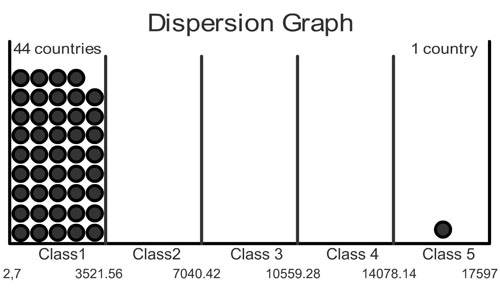 (Institute of Cartography) (Institute of Cartography) |
| Mean-Standard Deviation | 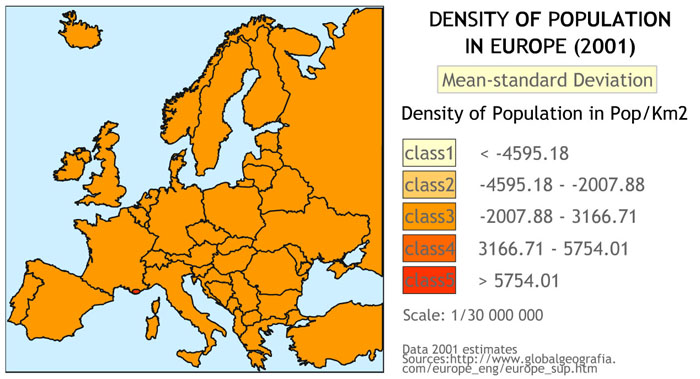 (Institute of Cartography) (Institute of Cartography) |
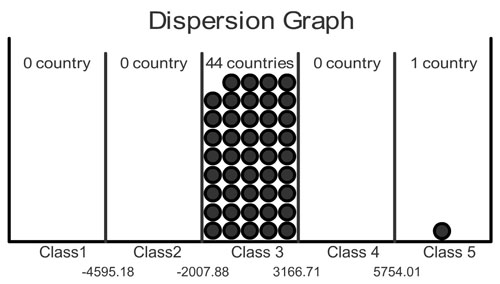 (Institute of Cartography) (Institute of Cartography) |
| Quantiles |  (Institute of Cartography) (Institute of Cartography) |
 (Institute of Cartography) (Institute of Cartography) |
| Maximum Breaks |  (Institute of Cartography) (Institute of Cartography) |
 (Institute of Cartography) (Institute of Cartography) |
| Natural Breaks |  (Institute of Cartography) (Institute of Cartography) |
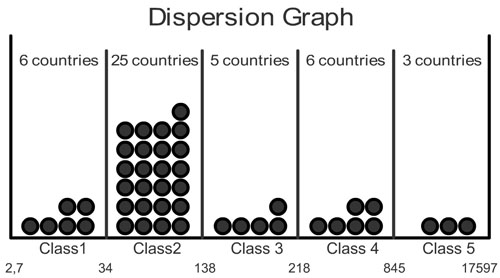 (Institute of Cartography) (Institute of Cartography) |
The pdf file Classification of
data introduces all major classification methods with their
advantages and disadvantages.
The decision on which method of classification should be used depends on the data. According to (1999) the following criteria can assist in selecting a classification method:
- Whether the method considers how data are distributed along the number line,
- Ease of understanding the method,
- Ease of computation,
- Ease of understanding the legend,
- Whether the method is acceptable for ordinal data, and
- Whether the method can assist in selecting an appropriate number of classes.
Update: 26.1.2012 (eLML) - Contact - Print (PDF) - © CartouCHe 2004-2007 (Creative Commons)
- layout based on YAML![]()